Probability of Occurence Curves (POC)
xmax: sets maximum x-limit
fname: outputname
dpi: resolution of plot
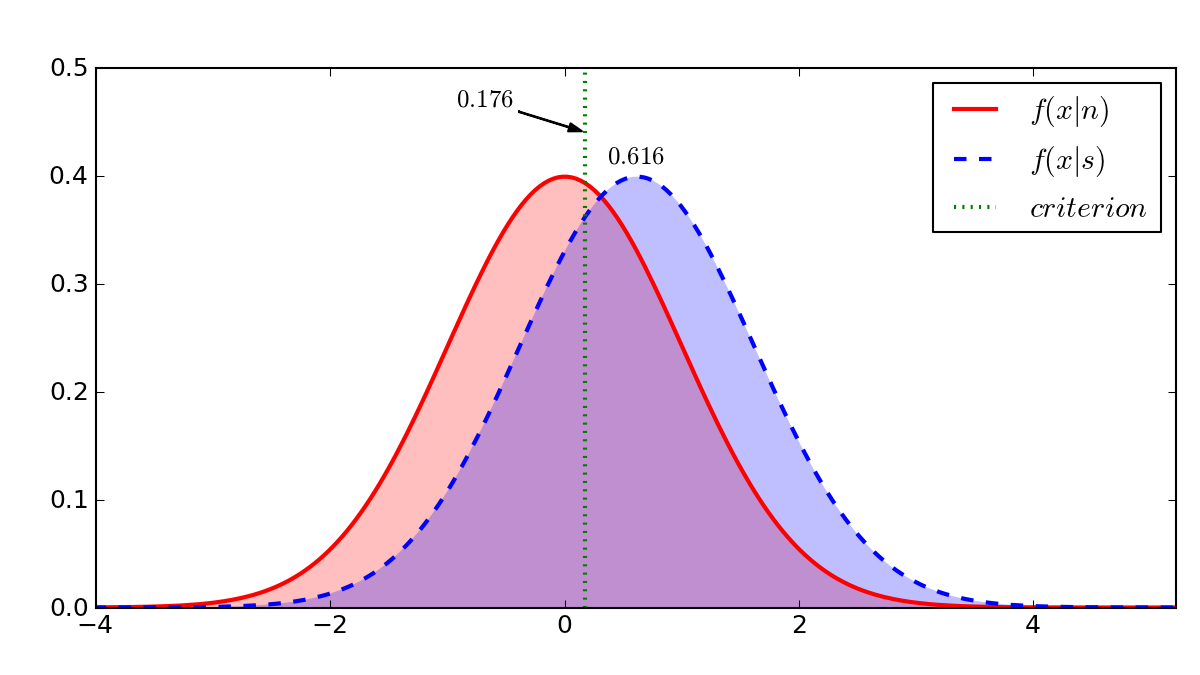
>>> from sdt_metrics.plotting import poc_plot
>>> poc_plot(.67, .43, fname='poc_example01.png')
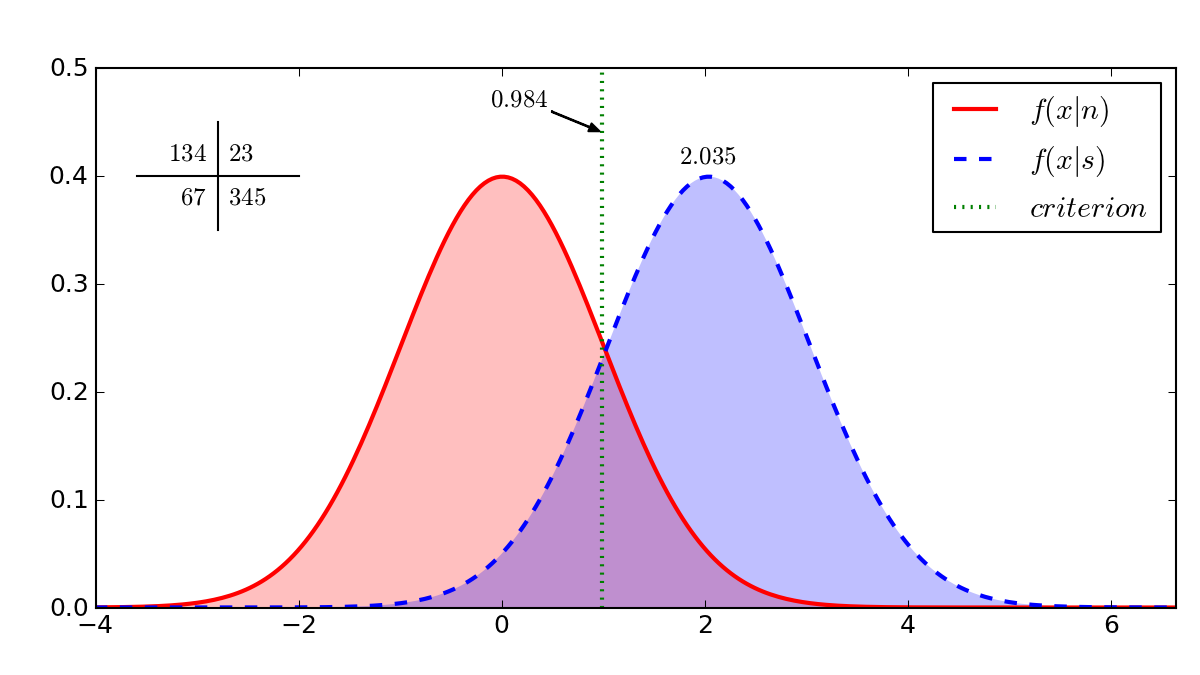
>>> from sdt_metrics.plotting import poc_plot
>>> poc_plot(134, 23, 345, 67, fname='poc_example01.png')
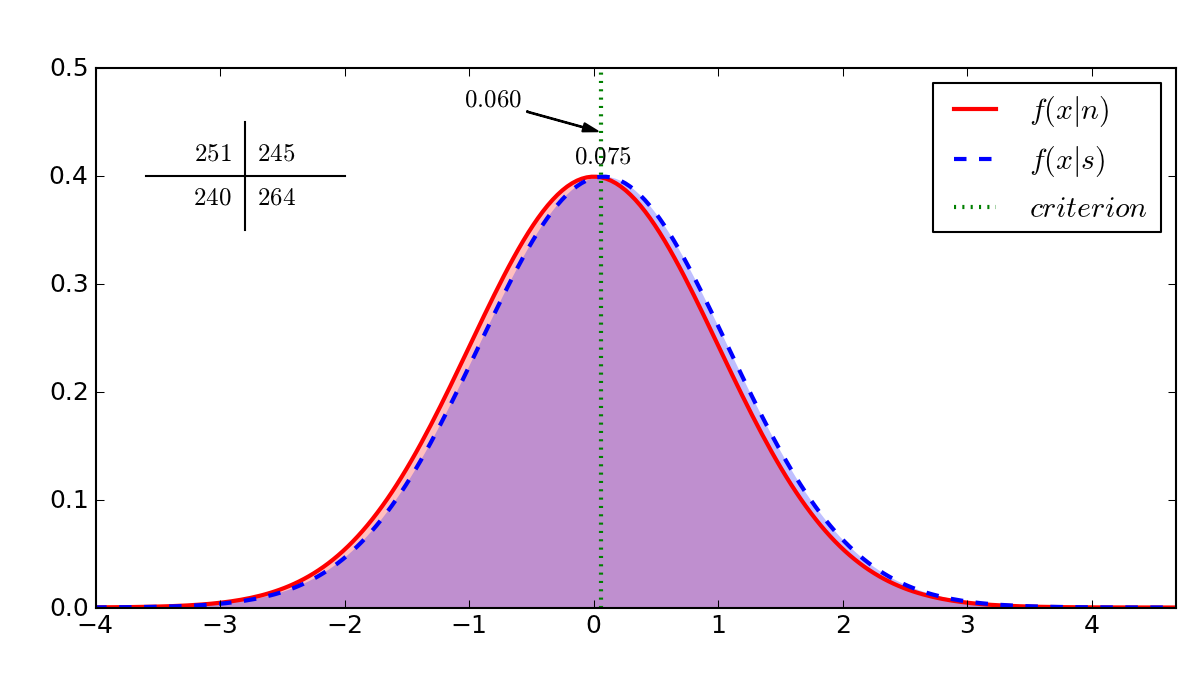
>>> from sdt_metrics import HI,MI,CR,FA, SDT
>>> from random import choice
>>> sdt_obj = SDT([choice([HI,MI,CR,FA]) for i in xrange(1000)])
>>> print(sdt_obj)
SDT(HI=251, MI=245, CR=264, FA=240)
>>> poc_plot(sdt_obj, fname='poc_example03.png')