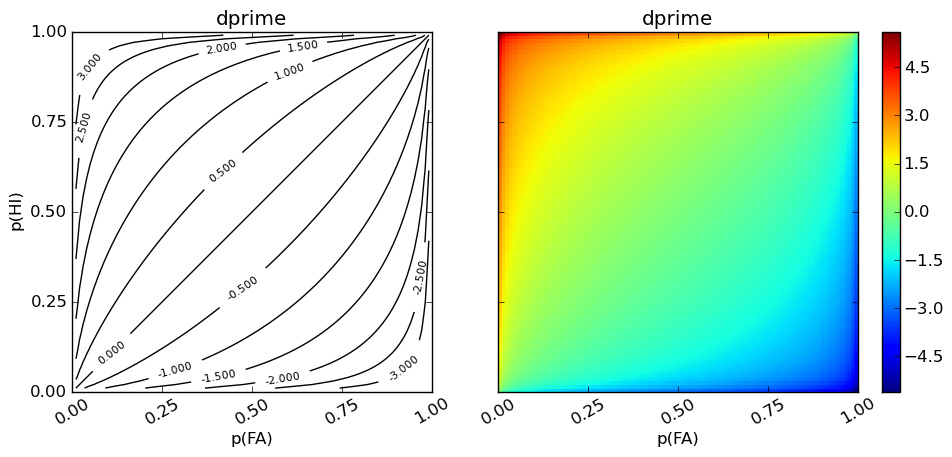
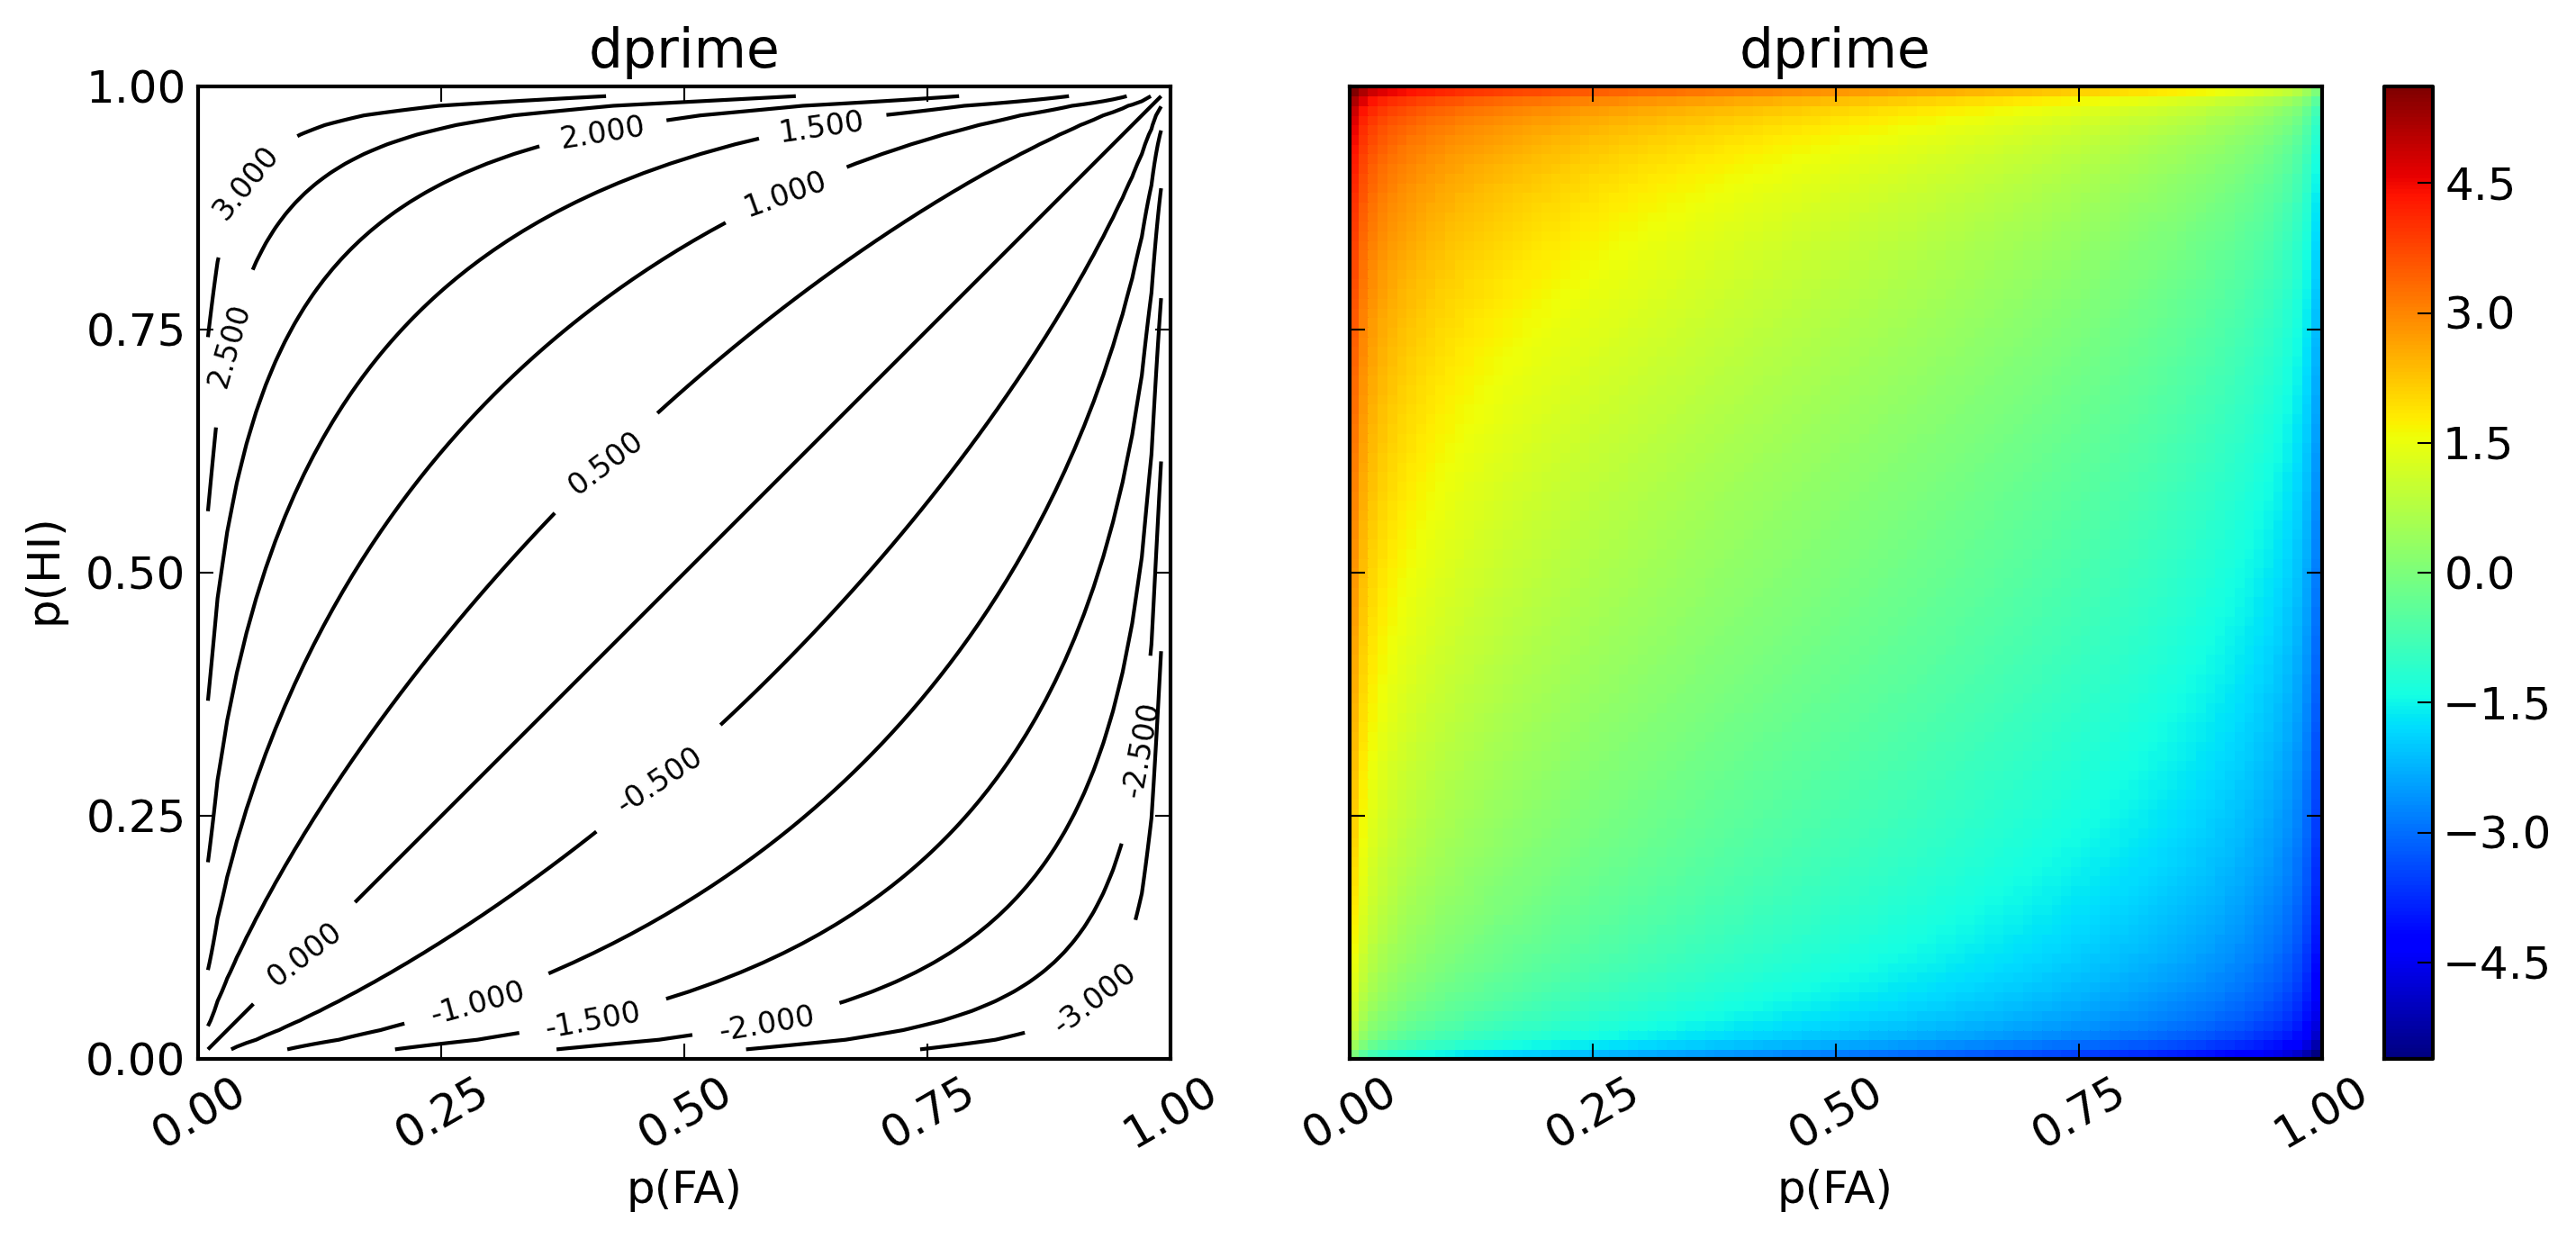
d’: parametric measure of sensitivity
Extremely popular measure adapted by from communication engineering by psychologists in the 1950s [1]. Most notable text is Green and Swets [2]. Calculation uses the formula given by Macmillan [3]. Extreme probabilities of 0 and 1 are treated using the correction suggested by Macmillan and Kaplan [4]. Rates of 0 are replaced with 1/(2n) and rates of 1 are replaced wtih 1 - 1/(2n). This approach has been shown to be biased (Miller [5]). Hautus’s [6] loglinear approach may be preferred. For a more extensive overview on treating extreme values see Stanislaw and Todorov [7].
See also
[1] Szalma, J. L., and Hancock, P. A. Signal detection theory. Class Lecture Notes. http://bit.ly/KIyKkt
[2] Green, D. M., and Swets J. A. (1996/1988). Signal Detection theory and psychophysics, reprint edition. Los Altos, CA: Penisula Publishing.
[3] Macmillan, N. A. (1993). Signal detection theory as data analysis method and psychological decision model. In G. Keren & C. Lewis (Eds.), A handbook for data analysis in the behavioral sciences: Methodological issues (pp. 21-57). Hillsdale, NJ: Erlbaum.
[4] Macmillan, N. A., and Kaplan, H. L. (1985). Detection theory analysis of group data: Estimating sensitivity from average hit and false-alarm rates. Psychological Bulletin, 98, 185-199.
[5] Miller, J. (1996). The sampling distribution of d’. Perception and Psychophysics, 58, 65-72.
[6] Hautus, M. (1995). Corrections for extreme proportions and their biasing effects on estimated values of d’. Behavior Research Methods, Instruments, and Computers, 27, 46-51.
[7] Stanislaw H. and Todorov N. (1999). Calculation of signal detection theory measures. Behavorial Research Methods, Instruments, and Computers, 31 (1), 137-149.
Calculates metric based on hit, miss, correct rejection, and false alarm counts
Calculates metric based on hit rate and false alarm rate
based on the number of args and the availability of .prob routes call to appropriate method.